| HOME | FEATURES | DOWNLOAD | DISCLAIMER | CONTACT | FORUM |
|
| Have a look through the Sliver User's Manual... |
Sliver helps you explore your data |
|
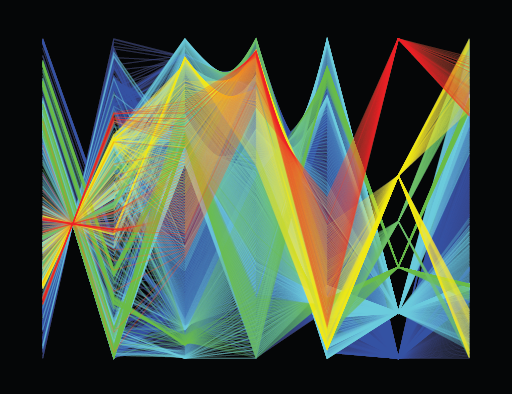
Sliver is a powerful and intuitive software application for multi-dimensional (multivariate) data visualization and analysis on Windows. It is absolutely free. Graph your data on multi-axis parallel coordinate (PC) plots, PC plot matrices, various types of configurable 2D and 3D scatterplots, and plots overlaid on Google Earth, all fully linked by extensive support for swiping and color brushing. Animate your data with the Grand Tour, a rotation through n-space that dramatically reveals multivariate correlations and structures. Synchronize your data with external programs. Input real-time data for monitoring and analysis. Sliver is highly versatile without requiring any scripting. Sliver inputs data from CSV or tab-delimited TXT files, easily supporting 50 or more variables and 100,000 or more rows of data, with many input, output and display settings. A DataTools menu contains functions to manipulate (munge) data in the input file. For presentation, plots can be exported to PDF in vector form with alpha-blended transparency to reveal inner structures. As you interactively work in Sliver, the highly visual displays reveal correlations, patterns, trends and anomalies. These in turn can significantly aid in finding relationships in a dataset and characterizing normal and abnormal behavior of a system. Sliver is an engaging and effective way to explore your data. |